I wrote a post earlier about the integration between Microsoft Defender ATP (MDATP), Intune and conditional access. In that post I mentioned some of the investigation capabilities within MDATP, but left one key feature unexplored. So I wanted to dedicate one short post solely on that feature – Live Response.
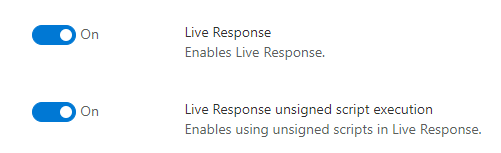
Live Response is a fairly new feature allowing real-time access to clients managed by MDATP. The feature is not enabled by default, so you’ll have to enable it in the advanced features blade (note, that your clients must also be running Windows 10 version 18323 or later). There is a separate setting also for allowing unsigned scripts to be executed via the console (this relates to the PowerShell script execution capability explored later in the post).
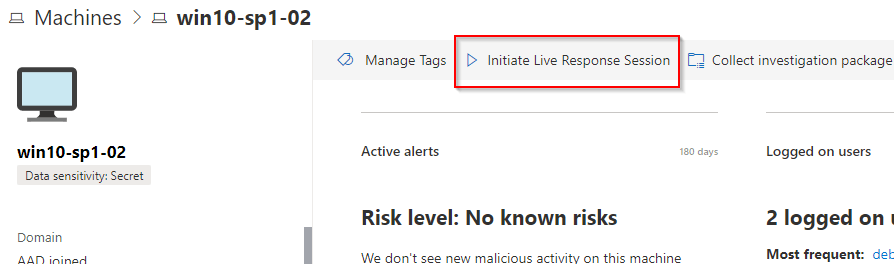
Once you’ve enabled the feature, you can see the Initiate Live Response Session option on the machine page:
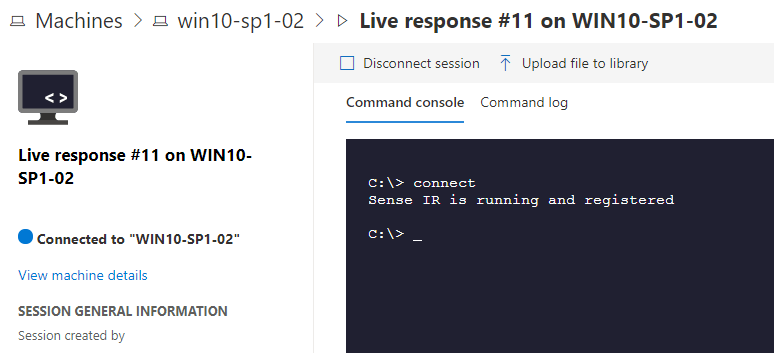
Selecting the option launches a command line interface on the browser:
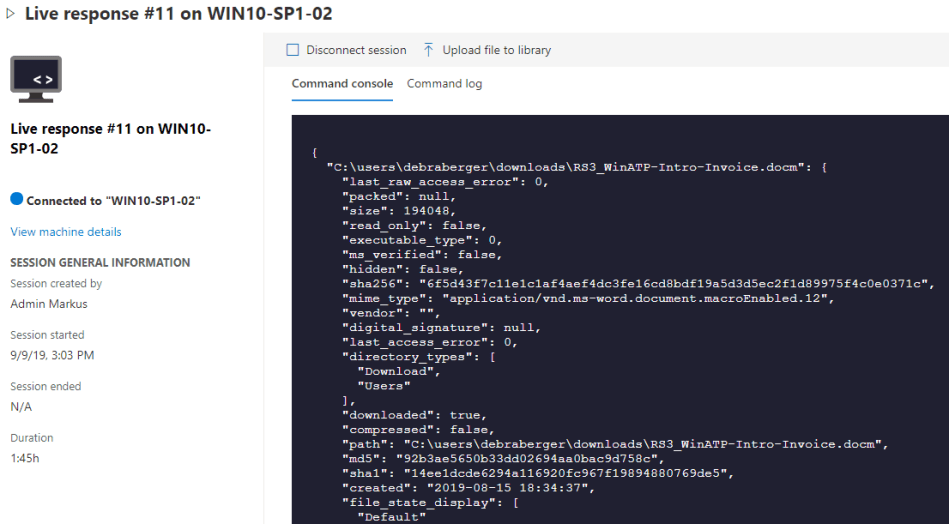
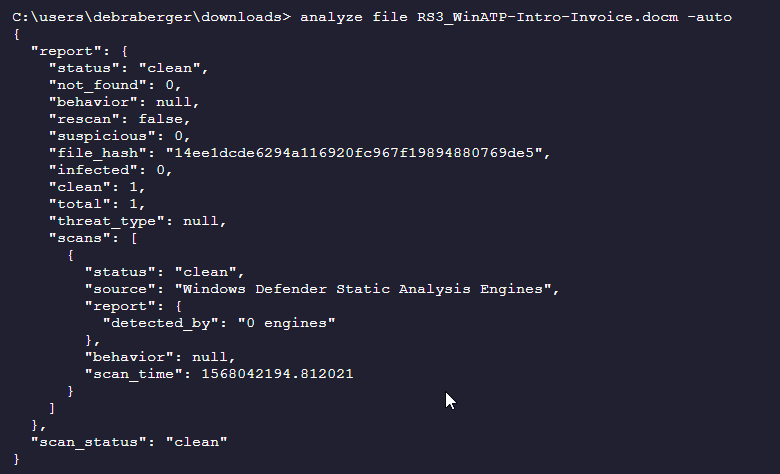
Note, that this console is not a normal Windows command prompt, but you’ll only have a limited number of commands available. You can find the full list of available commands here. There are a number of useful commands to inspect running processes, network connections, registry, etc. You can also inspect files and perform static analysis (in this case, the malicious Word document used in the previous blog post came out clean):
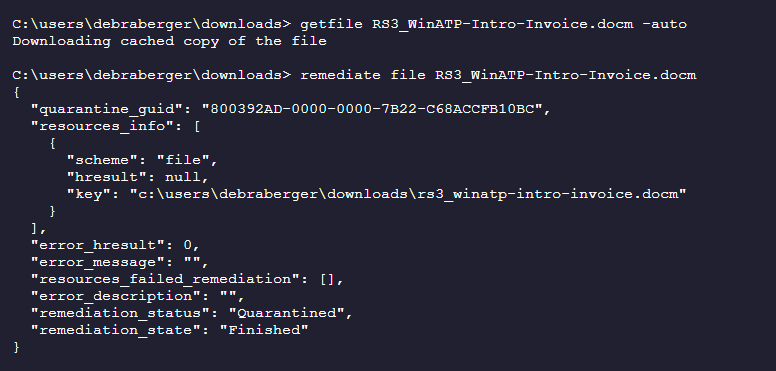
One useful command is getfile which allows you to download individual files from the remote client. If you have an analysis machine with proper tools in place, you can continue investigations there. You can also quarantine the file on the remote client by running remediate.
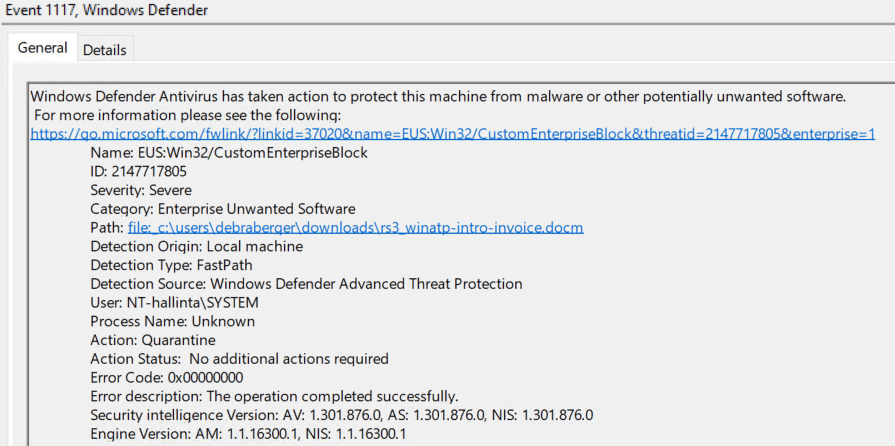
The quarantine event is logged in the Windows event log of the client:
Gimme PowerShell!
While the set of out-of-the-box commands provided by the Live Response console does provide a useful tool set, it clearly has its limitations. Luckily, it also supports running custom PowerShell scripts on the remote client. Now, this is not an interactive PowerShell session, so it may sound a bit cumbersome. But it does work surprisingly well.
For my testing, I’m just running a couple of commands, but I want it to run for some time so that I can have a look at the process itself.
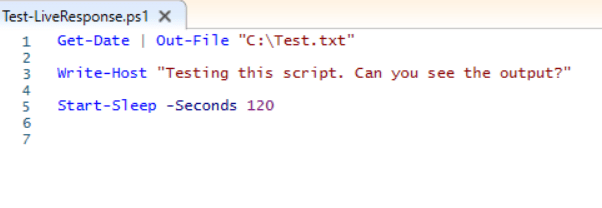
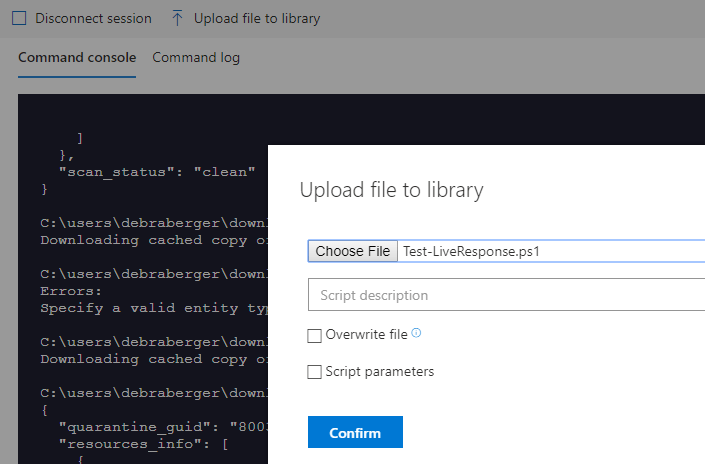
What I need to do first is to upload the file to the library. I also have the option to add parameters to the script.
I can verify that the file has been added to the library by running library on the console. The same command also allows to remove files from the library.

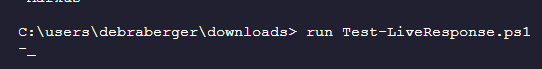
To run the script, I use the run command:
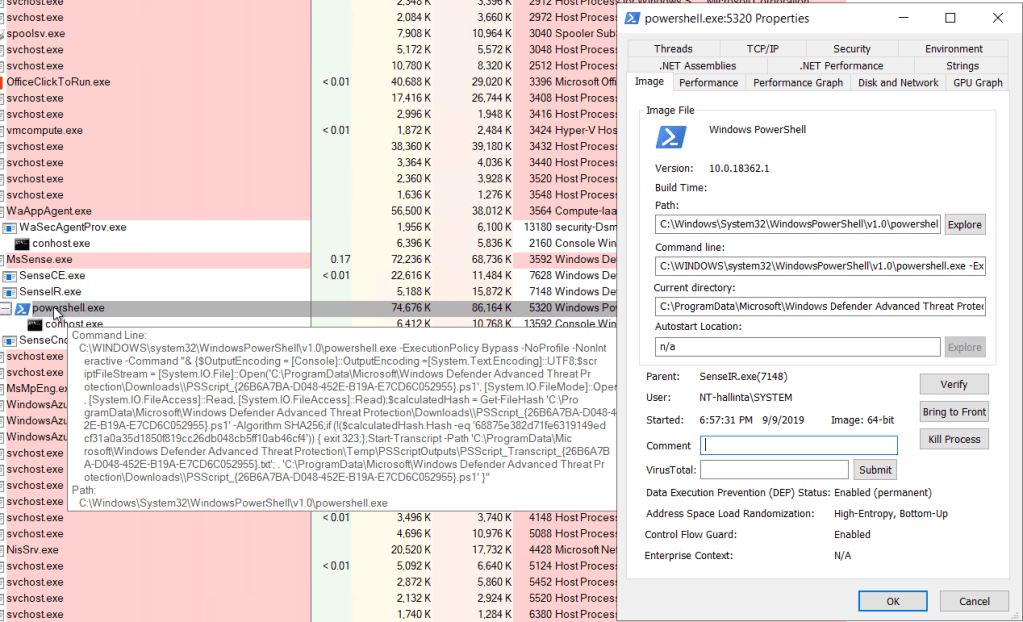
After a minute or so, I can see the PowerShell process in Process Explorer, and it’s running as a child-process of SenseIR.exe (under local system account).
Once the script execution is finished, the output is printed on the console. It will also pipe the output into a file that you can easily download to your local machine using the getfile command (the output file also contains information about the PowerShell version, the process ID used, etc.).

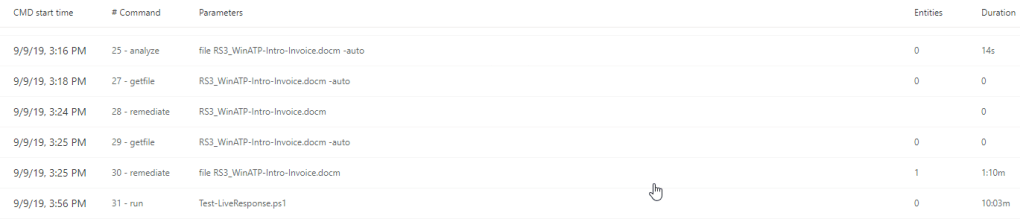
All the commands executed via Live Response are retained in the command log. This keeps a nice audit trail of the activities performed (although, the commands within the PS scripts are not shown, just the name of the script and the output file):
Summary
This was a quick introduction to the MDATP Live Response feature. Overall, this is a necessary addition to the toolkit. While the commands available at the interactive console is fairly limited, it seems to tackle the most critical use cases. And with the ability to download files and run PS scripts, this can be a powerful tool for the incident response teams.

0 comments on “Defender ATP and Live Response”