
Azure AD Sentinel Workbook sweetness
Background
I am currently in the process of enriching logs for a bit larger project. Where I’ve had easy, and less easy victories…


Don’t get me wrong, I enjoy doing that, but I also like easy victories (I mean, saving time and getting the value you we’re looking for in the first place, sounds like a good deal to me. pretty good Return Of Investment)
Disclaimer: If your interested about Azure Sentinel, sign-in logs, and Azure AD capabilities in general, and want to get started from the ground there exists lot of good resources which have information available. This blog is about getting single value adding feature into an existing feature.
Azure Sentinel Workbooks!
Essentially I was looking for an easy way out (the old PowerBi based solution is also deprecated). And I knew Azure Sentinel provides ton of value with pre-made workbooks for your investigations: So I wanted to do two things
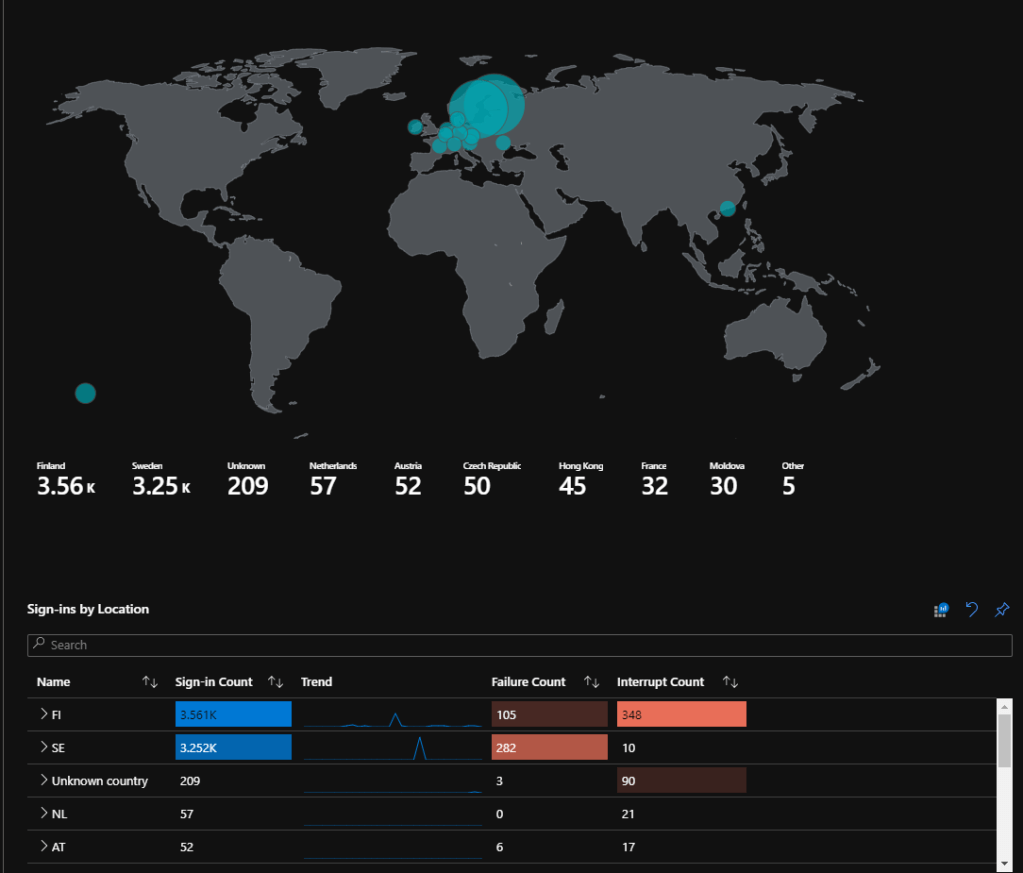
- Get some sign-in data of the initial fresh sign-in
- plot that data to the map
Those two we’re the only things it took. I almost feel guilty for getting something done this easy… 🙂
How?
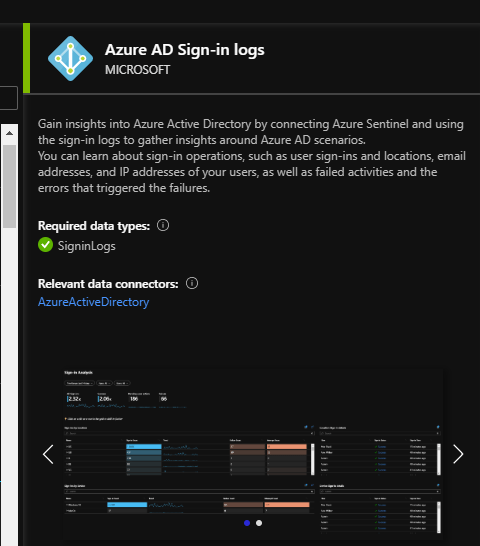
For 1. I can use the existing excellent Azure AD Sign-in logs workbook
For 2. I can just add this dead simple section to the existing workbook
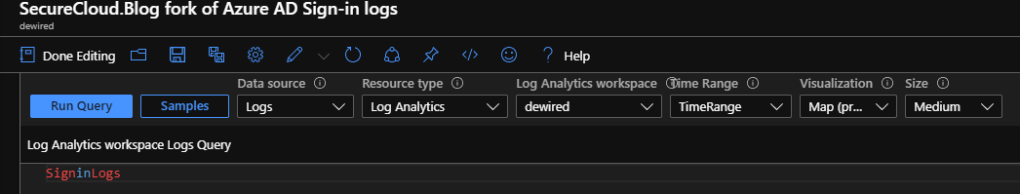
- Fork the existing workbook
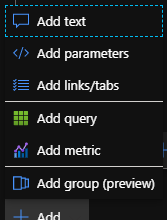
- Scroll to the bottom of the workbook and select ’add’ query
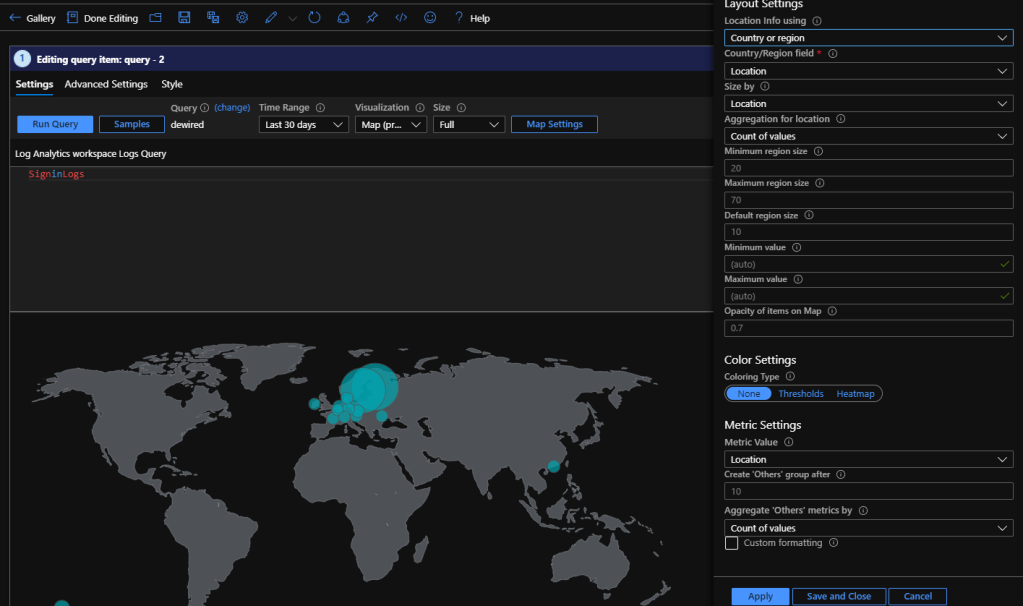
- Query is Sign-In logs as in ’SignInLogs’ (I said dead simple. I mean it )
- You could obviously tighten the query a bit, to exclude non-plottable events
- Select from Visualization ”Map”
- Click run query to get map settings
- Configure following settings for the map and click ’Save and close in the bottom’
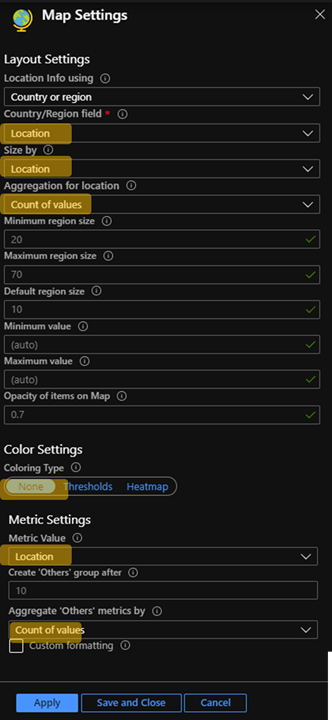
- Now move the map to desired position:
What does it cost?
- Azure AD Sign In logs just got to position of requiring no extra licensing
- Sentinel Pricing https://azure.microsoft.com/en-us/pricing/details/azure-sentinel/
Br Joosua!

0 comments on “Ton of value with Azure Sentinel – Plotting Azure AD Sign-in locations to an map”